Building a Data Quality Scorecard for Your Logistics Operation
Bad data costs logistics companies 15-25% of revenue through wrong decisions. A data quality scorecard monitors completeness, accuracy, freshness, and consistency to protect your analytics.

The Hidden Tax of Bad Data
Every logistics analytics initiative rests on an assumption that the underlying data is trustworthy. When it is not — and it often is not — the consequences are expensive. Gartner estimates that poor data quality costs organizations an average of $12.9 million per year. In logistics, bad data manifests as incorrect rate calculations, flawed demand forecasts, unreliable carrier scorecards, and customer reports that do not match the customer's own records. Each error erodes trust in the analytics platform and pushes decision-makers back toward gut feel.
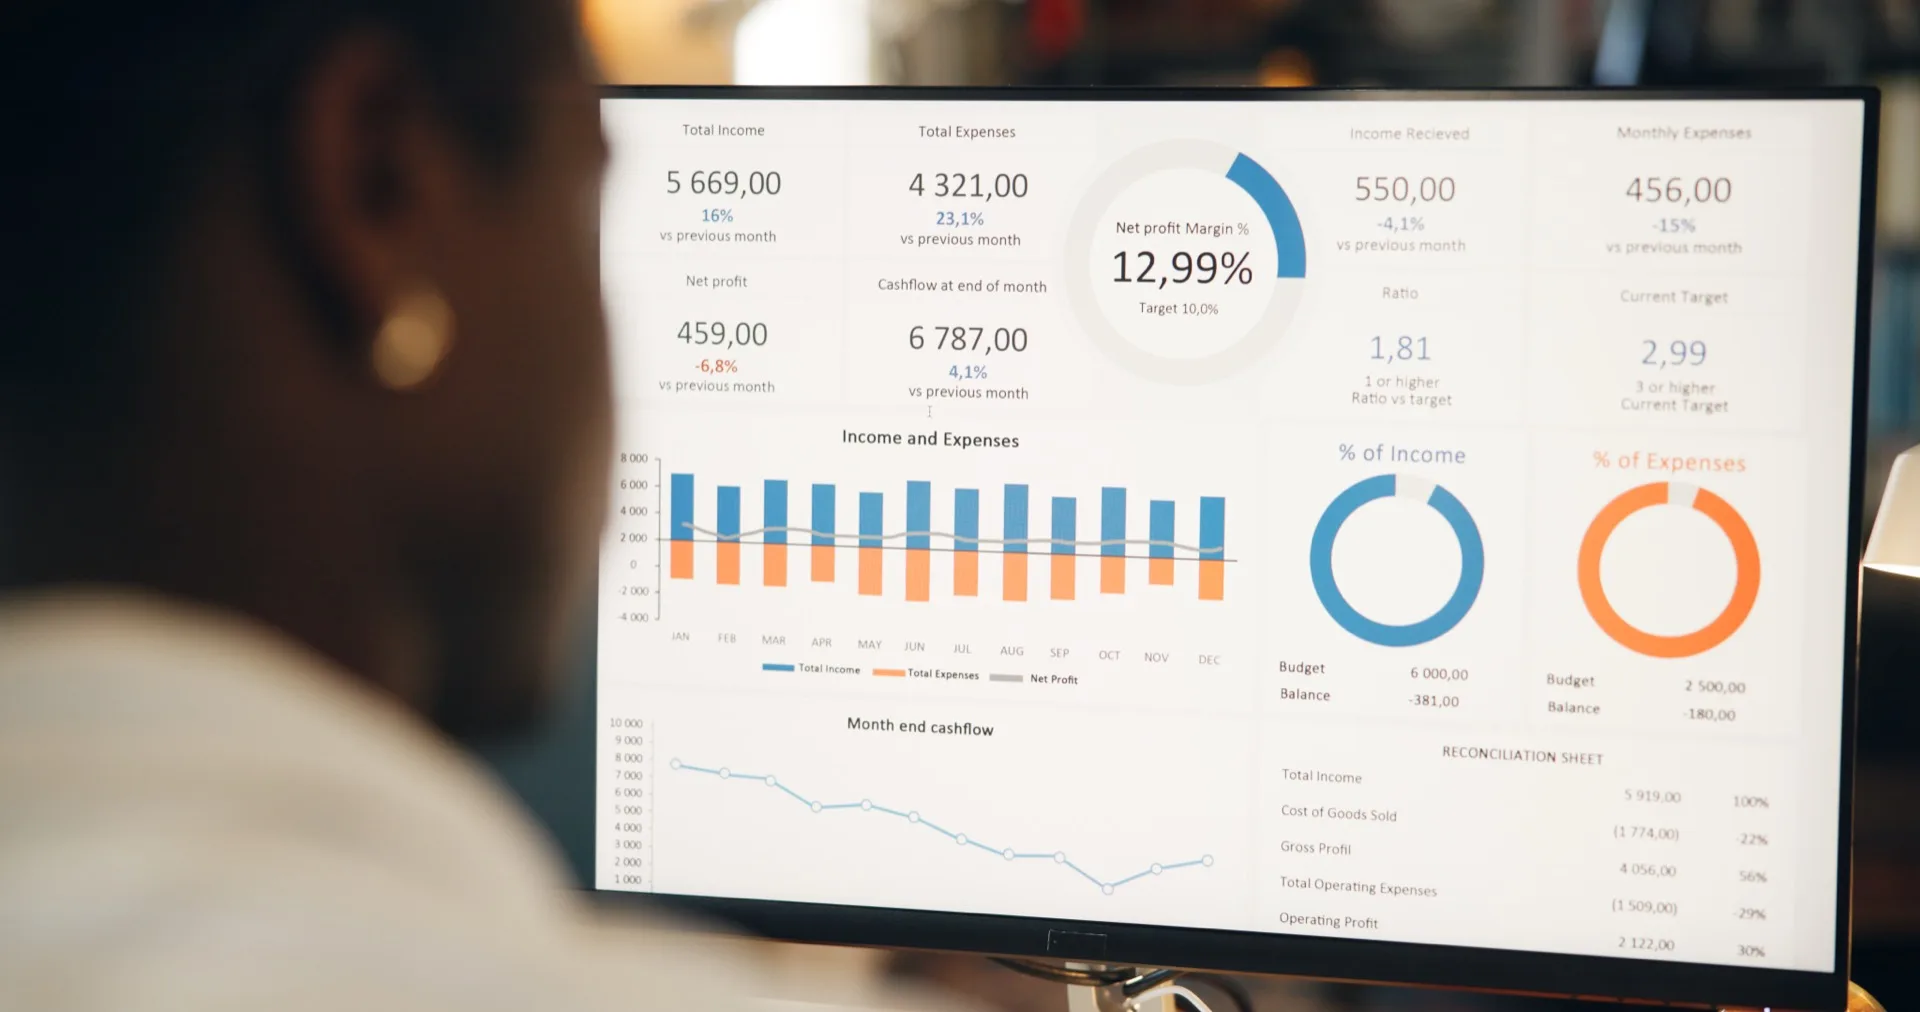
A data quality scorecard makes data health visible and measurable. Instead of discovering data problems when a dashboard shows impossible numbers or a customer disputes a report, you monitor data quality continuously and address issues before they contaminate downstream analytics.
The Four Dimensions of Data Quality
A comprehensive data quality scorecard measures four dimensions, each capturing a different aspect of data health:
Completeness: Whether the Required Fields Are Filled In
Completeness measures whether all required fields are populated across your data records. In logistics, common completeness issues include:
- Shipment records missing weight or dimensions (causing inaccurate cost calculations)
- Customer records without industry classification (preventing meaningful segmentation)
- Carrier invoices missing reference numbers (blocking automated matching)
- Delivery records without timestamps (preventing accurate transit time measurement)
Measure completeness as a percentage for each critical field: "Weight data is present on 94% of shipment records." Set targets based on what your analytics require — if margin calculation needs weight, dimensions, and rate, all three must be at 98%+ completeness for the margin metric to be reliable.
Accuracy: Whether the Values Are Right
Accuracy measures whether populated fields contain correct values. This is harder to measure than completeness because you need a reference point. Common accuracy checks include:
- Range validation: Weight values between 0.1 kg and 50,000 kg for ocean freight, flagging obvious data entry errors like 0 kg or 999,999 kg
- Referential integrity: Every carrier code in shipment records matches a valid carrier in the master data
- Cross-system consistency: Revenue recorded in the billing system matches revenue recorded in the analytics platform for the same period
- Historical consistency: A customer's average shipment weight this month is within two standard deviations of their 12-month average, flagging potential data entry errors
Freshness: How Current the Data Is
Freshness measures how current your data is. In logistics, stale data directly impacts decision quality. If shipment tracking data is updated once daily instead of in real time, your transit time calculations lag by 12-24 hours. If carrier rate data has not been updated in 60 days, your pricing team is quoting based on obsolete information.
Track freshness by measuring the maximum age of the most recent record for each data source. Shipment tracking should update within minutes. Rate tables should update within 24 hours of a carrier rate change. Customer master data should be reviewed quarterly at minimum.
Consistency: The Same Value in Every System
Consistency measures whether the same data point has the same value across all systems where it appears. A customer name spelled differently in the TMS and the billing system creates matching failures. A shipment weight recorded differently in the booking and the invoice causes audit discrepancies. Consistency checks compare critical fields across systems and flag mismatches for resolution.
Proof, not a pilot
Put this to work on your own operational data.
No integration project. No black box.
Start a 90-Day Proof of ValueBuilding and Scoring the Scorecard
Assign each dimension a score from 0-100 based on pass rates across all monitored checks. Weight the dimensions based on their impact on your specific analytics use cases — for a company focused on margin analytics, accuracy and completeness of financial fields might carry 60% of the total weight. Calculate a composite data quality score that provides a single health indicator.
Set thresholds for action: above 90% is healthy (monitor only), 80-90% requires attention (investigate and remediate within a week), below 80% is critical (immediate investigation, consider pausing analytics that depend on the affected data). Display the scorecard alongside your operational dashboards so that data quality is visible every day, not just during periodic audits.
Turning a Score Into a Fix
A scorecard without action is just a vanity metric. Each quality issue identified should generate a remediation ticket with a clear owner, root cause, and fix timeline. Common root causes include: manual data entry without validation rules, system integrations that silently drop fields, master data that has not been updated after organizational changes, and format mismatches between systems that truncate or corrupt data during transfer.
Syntask's data quality module continuously monitors all four dimensions across your logistics data, automatically identifies quality issues, traces them to their root cause, and tracks remediation progress. The investment in data quality pays for itself by protecting the far larger investment you have made in analytics. No model, however sophisticated, outperforms the data it is fed.
Put this to work on your own operational data.
Start with one lane, one workflow, one decision. Measure impact. Expand when value is proven.
No integration project. No black box.
Written by
Berna Bulgurcu
Co-founder & CEO, Syntask
The Syntask team writes about operational decision intelligence for logistics — turning the data teams already have into prioritized, evidence-backed decisions.
Topics
- Data Quality
- For Data Teams
- How-To Guide
- Best Practices