Building Your First Automated Report: A Beginner's Guide
Stop spending hours on manual reporting. This beginner-friendly guide walks you through creating your first automated report with scheduling, formatting, and distribution.
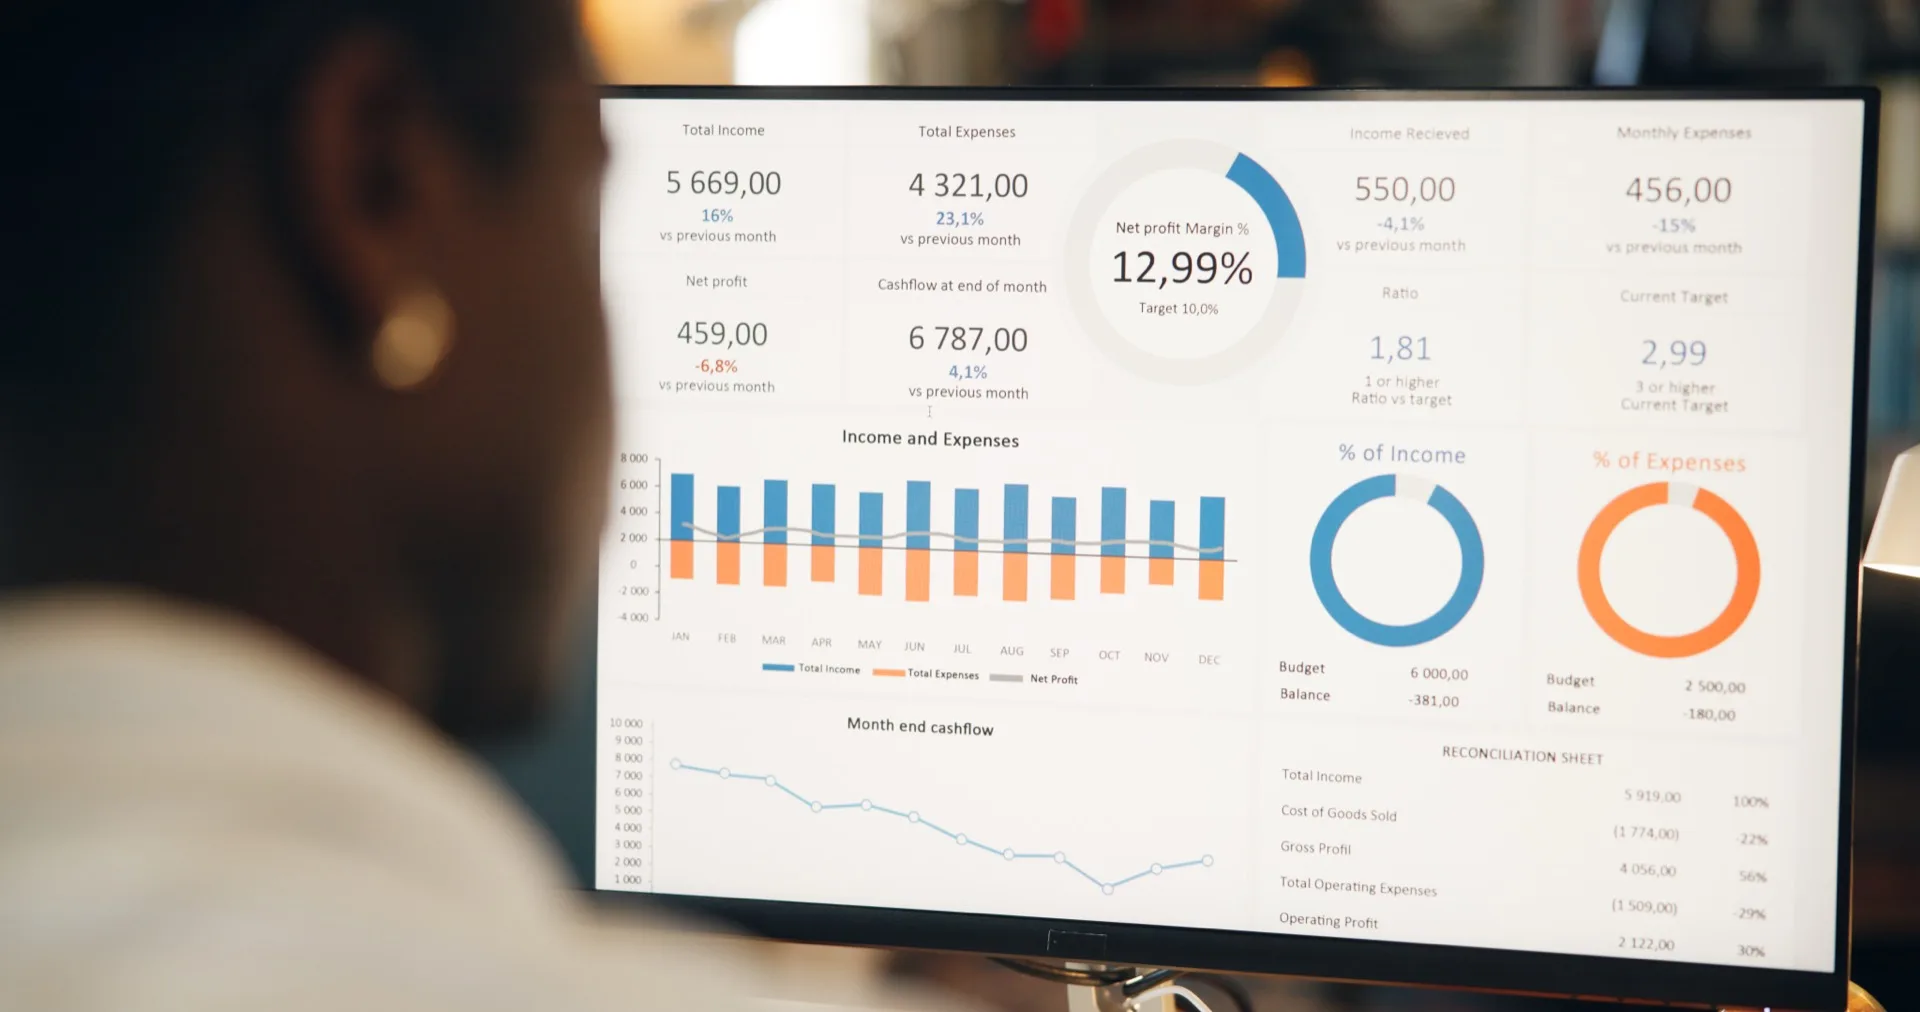
What the Monday Morning Report Actually Costs
Most logistics companies have at least one person who spends 4-8 hours every Monday morning compiling a weekly report. They open the TMS, export shipment data, paste it into a spreadsheet, build pivot tables, format charts, write commentary, and email the result to a distribution list. The process is repeated nearly identically every week, with minor variations for whatever happened to stand out.
This ritual costs more than it appears. At a fully loaded cost of $50-75 per hour for an experienced operations analyst, a weekly report that takes 6 hours consumes $15,000-$23,000 per year — for a single report. Most organizations produce 5-10 regular reports, putting the total cost of manual reporting at $75,000-$230,000 annually. Beyond the direct cost, there is the opportunity cost: those hours could be spent on analysis, customer engagement, or process improvement.
Automated reporting eliminates the repetitive work while maintaining — and usually improving — report quality. Once configured, an automated report runs on schedule, pulls current data, applies consistent formatting, and distributes to the right people without human intervention. This guide walks you through building your first one.
Step 1: Choose the Right Report to Automate First
Not every report is equally suitable for automation. The best candidates share three characteristics:
- Regular cadence: Weekly or monthly reports that follow the same structure every cycle. Ad-hoc, one-time analyses are not automation candidates
- Structured data sources: Reports that pull from databases, TMS exports, or APIs rather than requiring manual data collection from emails or phone calls
- Broad distribution: Reports that go to multiple recipients. The more people who receive it, the higher the value of making it consistent and timely
For most logistics companies, the weekly operations summary is the ideal first automation target. It has a fixed cadence, pulls from the TMS, and goes to the entire operations and management team. It is also typically the report that consumes the most analyst time.
What Should Your First Automated Report Include?
Keep the scope focused for your first automation. A weekly operations summary should include: total shipments (with week-over-week change), total revenue and margin, top 5 lanes by volume, any shipments currently delayed or in exception status, and a carrier performance summary. This covers what 80% of recipients actually need to know. Advanced metrics and deep-dive sections can be added in later iterations.
Step 2: Configure the Data Source and Metrics
In Syntask, automated reports connect directly to your analytics data — the same data that powers your dashboards and queries. This ensures consistency: the numbers in the automated report always match what users see in the platform.
Configure the report by selecting:
- Metrics: Choose the KPIs that will appear in the report header — total shipments, revenue, margin percentage, on-time delivery rate, and exception count are common starting points
- Breakdowns: Define how data should be segmented — by lane, by customer, by carrier, by mode. Each breakdown produces a section in the report with a table or chart
- Filters: Set any global filters — for example, excluding internal test shipments or limiting to a specific business unit
- Comparison period: Define what the current data should be compared against — previous week, same week last year, or a custom baseline
The configuration process is a one-time investment. Once set up, the report pulls fresh data every cycle without any additional configuration. If your metrics or breakdowns change, you update the configuration once and all future reports reflect the change.
Proof, not a pilot
Put this to work on your own operational data.
No integration project. No black box.
Start a 90-Day Proof of ValueStep 3: Design the Layout and Formatting
Report formatting matters more than most analysts think. A well-formatted report gets read; a poorly formatted one gets skimmed or ignored. The key principles for automated report layout are:
Lead with the headline numbers. Put the 3-5 most important KPIs at the top of the report with large, clear typography. Use color coding — green for metrics trending positively, red for declining, gray for stable. Busy executives will read the top section and skip the rest unless something grabs their attention.
Use conditional formatting for exceptions. Tables should highlight rows that need attention — negative margins in red, delayed shipments in amber, metrics that breach predefined thresholds in bold. This guides the reader's eye to the items that require action rather than forcing them to scan every row.
Include brief narrative commentary. This is where AI-powered reporting adds the most value. Instead of static headers, Syntask's automated reports include AI-generated narrative summaries that explain the numbers in context: "Margin declined 2.1 points week-over-week, primarily driven by a rate increase on the Ningbo–Long Beach lane where carrier X raised rates by 8%. Three customer shipments were affected." This narrative turns a data table into a briefing document.
Step 4: Set Up Scheduling and Distribution
The final configuration step is deciding when the report runs and who receives it. Configure the schedule based on when the data is most useful:
- Weekly reports: Schedule for Monday morning (6:00 AM) so the report is in inboxes when the team starts the week. Ensure the data cutoff is Sunday midnight for a complete week
- Monthly reports: Schedule for the 2nd business day of the month, allowing time for any month-end data corrections to process
- Daily exception reports: Schedule for 7:00 AM with a rolling 24-hour data window, highlighting only items that need immediate attention
Distribution options typically include email (PDF or HTML format), Slack or Teams notifications with a link, and direct upload to a shared drive or customer portal. Choose the channel that matches your team's existing communication habits — putting a report where people already look is more effective than creating a new destination.
What Happens After Your First Automated Report Goes Live?
The first automated report is a proof of concept that builds confidence in the process. Once the team sees a polished, timely report arriving without anyone having to build it manually, the requests will follow quickly: "Can we automate the customer review report?" "Can we get a daily carrier performance summary?" "Can the finance team get an automated margin report?"
Each subsequent report is faster to build because the data connections and formatting standards are already established. A first report might take 2-3 hours to configure. The second takes 1 hour. By the fifth, you are setting up a new automated report in 30 minutes.
The compound effect adds up. Across a year, an organization that automates most of its recurring reporting can free up a substantial block of analyst time — often the equivalent of a full role or more — to redirect toward investigation, optimization, and analysis that actually improves outcomes rather than just documenting them.
Syntask's report automation module supports all of these capabilities out of the box: configurable metrics and breakdowns, AI-powered narrative commentary, conditional formatting, flexible scheduling, and multi-channel distribution. Start with one report, prove the value, and expand from there. The manual Monday morning reporting ritual can end this week.
Put this to work on your own operational data.
Start with one lane, one workflow, one decision. Measure impact. Expand when value is proven.
No integration project. No black box.
Written by
Berna Bulgurcu
Co-founder & CEO, Syntask
The Syntask team writes about operational decision intelligence for logistics — turning the data teams already have into prioritized, evidence-backed decisions.
Topics
- Automation
- For Operations Managers
- How-To Guide
- Efficiency